TL;DR: AMZScout and SellerSprite both estimate Amazon sales and keyword data from public signals, and neither can see Amazon's real numbers, so accuracy comes down to how small and how consistent each tool's error is in your category. This guide gives you a reproducible five-part accuracy test, shows where each tool's US data tends to hold up, and helps you choose based on your seller type instead of marketing claims.
Key Takeaways
- No third-party tool, AMZScout and SellerSprite included, has access to Amazon's true unit sales. Every figure is a model output, so judge tools by error size, error consistency, and ranking order rather than by exactness.
- Sales estimates and keyword data are built from different inputs and should be tested separately, with different reference data: Business Reports and Brand Analytics for sales, Search Query Performance and search frequency data for keywords.
- A credible test needs 20 to 30 control ASINs in your own category, a locked 30-day window, one consistent unit (units sold or revenue, not both mixed together), and at least two verifiable ground-truth sources.
- Directional accuracy matters more than decimal precision. If a tool orders opportunities the same way your verified data does, it is usable for go/no-go decisions even when its absolute number is off.
- Tool fit is mostly a workflow question: new sellers need guided research at low cost, growing sellers need keyword depth and rank tracking, and brands or agencies need bulk exports, API access, and team seats.
- Treat every published accuracy claim, including the patterns in this article, as a hypothesis to verify with your own 30-day test before you commit to an annual plan.
Table of Contents
- Why Data Accuracy Decides Your Product Research
- How AMZScout and SellerSprite Build Their Amazon Data
- The 5-Part Data Accuracy Test You Can Reproduce
- Reading the Results: What Actually Moves the Needle
- AMZScout vs. SellerSprite: Side-by-Side Comparison
- Which Tool Fits Which Type of US Seller
- Six Mistakes That Distort Any Accuracy Comparison
- Verdict: How to Decide in 30 Days
- FAQ
- References
Note on marketplaces: This guide is specifically optimized for the US market. Every test step, ground-truth source, and data point below assumes you are researching amazon.com listings and US shopper behavior.
Why Data Accuracy Decides Your Product Research
Every Amazon product decision starts with a number. How many units does this product sell per month? How much revenue does it generate? How many US shoppers search for this keyword? Those three figures decide your sourcing quantity, your advertising budget, your price band, and whether the niche deserves your time at all.
The uncomfortable part is that none of those numbers are published. Amazon does not disclose per-ASIN unit sales to anyone except the brand that owns the listing, and even then only inside Brand Analytics and Business Reports. Every third-party research tool produces estimates derived from public signals such as Best Sellers Rank movement, price history, category curves, and keyword ranking data. That is not a defect in one vendor's software. It is the structural reality of the entire Amazon data industry, and it is the reason a fair comparison between AMZScout and SellerSprite has to start with methodology instead of marketing.
The financial stakes are easy to underestimate. If your research says a niche moves 300 units per month and the real figure is 120, you do not simply lose a little margin. You order roughly two and a half times too much inventory, lock cash in stock that sits through two storage-fee cycles, and then discount to recover it. The opposite error is just as expensive: an underestimate makes a healthy niche look dead, and you skip a category you could have owned. Accuracy is not academic. It is cash flow.
What "accuracy" actually means in Amazon data
When sellers ask which tool is more accurate, they usually mean a single question: does the number match reality? In practice there are three separate errors hiding inside that question, and they have very different consequences.
- Level bias: the tool is consistently high or consistently low across many ASINs. This is the most forgiving error, because you can measure it on your control set and apply a correction factor in your own spreadsheet.
- Spread, or noise: the error swings randomly from product to product. This is the dangerous one. A 3x overestimate on one ASIN and a 60% underestimate on the next will quietly destroy an inventory plan, and you cannot correct for randomness.
- Staleness: the estimate was reasonable when it was collected, but the listing has since changed price, joined a deal event, or gone out of stock. Amazon data ages faster than most sellers assume, especially in promotional-heavy categories.
Most comparison pages only discuss the first error type, because it produces the cleanest headline. A genuinely useful evaluation covers all three, then adds the metric that actually drives day-to-day decisions: ordering. If a tool ranks ten opportunities in the same order your verified data does, it is useful even when its absolute numbers differ from the truth by double digits.
Who wrote this, how it was built, and where our bias sits
This guide is published by the SellerSprite content team, which means we sell one of the two tools being compared. We state that plainly instead of pretending to be neutral, because you should weigh our framing accordingly. What we can do to earn trust is be specific about method.
How this article was built: we reviewed each vendor's publicly documented approach to estimating sales and keyword data, translated that into a test framework any seller can run inside their own account in an afternoon, and flagged every claim that requires your own verification. We do not claim that a third-party-audited accuracy benchmark exists for either product, and we do not present invented results as established fact. Where this guide describes patterns that sellers and analysts commonly report, we label them as hypotheses for you to confirm.
Why it was written this way: the phrase "more accurate" is unfalsifiable in the abstract and easy to abuse. A testable method is more valuable to a seller than a claim, because the method keeps working after vendor pricing, data coverage, and interfaces change. Use the framework here the same way you would use a lab protocol, and let your own numbers decide.
How AMZScout and SellerSprite Build Their Amazon Data
Both companies are solving the same inverse problem: reconstruct sales and demand from signals Amazon publishes indirectly. Understanding the pipeline helps you predict where each tool is likely to be strong or weak in your niche, which is more useful than memorizing a verdict.
The shared pipeline behind almost every Amazon estimation tool
- Rank collection. Scheduled snapshots of Best Sellers Rank within each subcategory. Because BSR is relative and recalculated hourly, the sampling frequency and the historic depth of those snapshots directly affect how well the tool can detect a trend.
- Category conversion curves. A model that translates a BSR value into estimated daily units for that specific category. A rank of 5,000 in one subcategory means something completely different from 5,000 in another, so the curve shape is where most vendors invest their engineering effort.
- Price history. Units multiplied by price produces revenue. If a tool assumes the current list price while the listing has been running a coupon or a Lightning Deal, the revenue estimate drifts even when the unit estimate is sound.
- Velocity cross-checks. Review counts and rating velocity, plus Amazon's own coarse "bought in past month" badge, are used to sanity-check the curve output. These are noisy but useful for catching gross errors.
- Seasonality and trend layers. Indices for categories that swing hard during Q4, spring, or back-to-school. Without this layer, a December snapshot in a gift category will overstate the year-round run rate.
- Calibration sets. A group of products whose real performance is known, used to tune the model. This is the single most important variable, because it determines both the bias and the spread you will measure later.
Keyword data follows a parallel pipeline: collecting Amazon autocomplete and related-search suggestions, tracking which products rank for which terms, aggregating click and conversion signals, and, in the better implementations, anchoring estimates to Amazon's own search frequency data so the numbers reflect Amazon demand rather than general web demand.
AMZScout's approach in plain English
Based on AMZScout's public product documentation, the platform is positioned as an all-in-one Amazon research suite: a searchable product database with modeled sales estimates, a keyword research module with search volume and related terms, a product tracker for monitoring listings over time, browser extension overlays on the Amazon page itself, and a substantial library of training material aimed at newer sellers. Its sales estimates are described as modeled from rank, category, and price signals rather than from direct transaction data, which is true of every tool in this space. Features, plan limits, and data coverage change frequently, so verify the current specifics on the vendor's site before you buy.
SellerSprite's approach in plain English
SellerSprite is built keyword-first. The core of the product is a large Amazon keyword database covering major marketplaces, combined with reverse-ASIN analysis that shows which keywords an existing listing receives traffic and conversions from, estimated search volume and difficulty, traffic and sales overlays in the browser extension, and bulk research or API workflows for sellers and agencies that process large lists. Its keyword estimates lean on Amazon search frequency style data and translate it into an estimated volume range, which is why the tool is typically used for keyword expansion and competitor traffic analysis rather than for a single headline sales number. As with any vendor, confirm current coverage, plan limits, and API terms on the official site.
Why two tools can both be "right" and still disagree
When AMZScout and SellerSprite show different numbers for the same ASIN, sellers often assume one of them is broken. Usually the gap comes from six design choices:
- Calibration window. One model might average the last 30 days, the other the last 90. In a trending category the two will disagree by design.
- Variant handling. Whether child ASINs are reported separately or rolled into the parent changes the numbers dramatically for apparel-size and color-heavy listings.
- Deal and coupon treatment. A listing that ran a week-long promo can be read as a permanent run-rate by one model and smoothed out by another.
- Subcategory versus root category BSR. The same product has different ranks in different nodes, and the curve attached to each node differs.
- Units versus revenue reporting. Revenue is units times an assumed price, so price assumptions alone can create a 20 to 30% gap with identical unit models.
- Refresh cadence. A tool that updates daily will show a different picture than one that updates weekly, particularly right after a ranking shift.
This is why the productive question is never "which tool is accurate?" It is "which tool is accurate for my category, in the metric I actually use to make decisions?" That question is answerable, and the next section shows you how.
The 5-Part Data Accuracy Test You Can Reproduce
You can run this entire test in one afternoon with a spreadsheet, your own seller account, and trial access to both tools. The goal is not to crown a universal winner. The goal is to know, for your category and your metrics, which tool you can responsibly plan inventory and advertising spend against for the next twelve months.
Part 0: Build a control set that can actually verify something
- Pick 20 to 30 ASINs. Include 8 to 12 of your own listings, because you have the only true ground truth available to a normal seller, and fill the rest with competitors in the same subcategory.
- Spread them across rank bands: a few in the top 100 of the subcategory, a few between 100 and 1,000, and a few between 1,000 and 10,000. Error behaves very differently at each band.
- Lock a 30-day window. Use the most recent complete calendar month so both tools are estimating the same period.
- Record the exact date and time you pull each tool's data. Data lag is real, and without a timestamp you cannot separate staleness from model error.
- Note whether your window was normal or distorted by Prime Day, Black Friday, or a category-wide promotion. If it was distorted, run the test again on a clean month.
Part 1: Sales estimate accuracy, with units and revenue measured separately
- Export estimated monthly units and estimated monthly revenue for every control ASIN from each tool.
- Pull ground truth for your own ASINs from Seller Central Business Reports: units ordered and ordered product sales for the same window. For competitors, use Amazon's coarse "bought in past month" badge, review velocity, and a triangulation of two or three independent tools. Treat competitor ground truth as directional, not exact.
- Calculate percentage error per ASIN: (estimate minus actual) divided by actual, times 100.
- Compute two summary numbers per tool: mean absolute percentage error, which tells you typical size of miss, and mean signed error, which tells you whether the tool leans high or low. A tool with a steady minus 18% bias is easier to work with than one that oscillates.
- Repeat the calculation per rank band. A tool can be strong in the top 100 and weak in the long tail, which matters enormously if you sell niche products.
- Report median error alongside the mean. One catastrophic miss on a single ASIN can hide behind a flattering average.
Part 2: Keyword search volume accuracy
Keyword volume is where sellers get tripped up most often, because they expect it to behave like Google Keyword Planner. It does not. Amazon keyword estimates are modeled from search frequency style data, ranking patterns, and click behavior, so the testable property is ordering, not the absolute number.
- Build a list of 30 to 50 keywords relevant to your niche, mixing head terms with long-tail phrases.
- Pull the estimated search volume for each keyword from both tools.
- Establish a reference ordering from Amazon's own data where you have access: Brand Analytics search frequency rank for the terms, and Search Query Performance impressions and clicks for keywords you have actively targeted.
- Rank your keyword list three times: once by each tool's volume estimate, and once by your reference data. Compare the top ten in each list and note how many terms overlap.
- Log the disagreements rather than the averages. The terms where the tools disagree most are usually the low-volume, long-tail phrases, and those are exactly the terms that decide whether a niche is reachable for a small seller.
If you want a deeper walkthrough of how Amazon search volume is actually derived and where each estimation method breaks down, our companion Amazon search volume tool guide covers the underlying data sources in detail.
Part 3: Keyword indexing and rank accuracy
- Choose 10 of your own ASINs and 10 keywords you know you rank for, confirmed in Search Query Performance.
- Check whether each tool reports the same indexed keywords. Missing indexation is a more serious error than a slightly wrong position, because it changes which terms you would optimize for.
- Compare reported organic position against what you observe. Amazon personalizes results by location and account history, so allow a tolerance of roughly three to five spots before calling it a miss.
Part 4: Opportunity ranking consistency
This is the part most sellers skip, and it is often the most decisive. Build a shortlist of 15 product opportunities from each tool using the same filters, then score those 15 with your own criteria: demand, competition intensity, estimated margin, seasonality risk, and supply complexity. Compare the tool's top five against your top five. If a tool's ordering matches yours, its model is aligned with how you actually decide, and that alignment is worth more than whether its sales number is 12% or 18% off.
Part 5: Timeliness, coverage, and workflow
- How quickly does a brand-new ASIN appear in the database after launch?
- How does the tool handle variations: separate children, parent rollup, or both?
- How deep is long-tail keyword coverage in your specific subcategory, not just in popular categories?
- What are the export limits, bulk research caps, API access rules, and team seat allowances on the plan you would actually buy?
- How much historical data is available for trend analysis, and how often is the US dataset refreshed?
- Can you filter by price band, seller type, and review count, or are the filters too coarse for a narrow niche?
Worksheet: scoring both tools on your own data
Copy this structure into a spreadsheet and fill it with your own results. The weights below are a reasonable starting point for a physical-products seller, not an industry standard, so adjust them to match your business model.
| Test | Suggested weight | AMZScout score (1-5) | SellerSprite score (1-5) | Evidence notes |
|---|---|---|---|---|
| Sales estimate accuracy, units | 25% | |||
| Sales estimate accuracy, revenue | 10% | |||
| Keyword volume ordering | 25% | |||
| Indexation and rank accuracy | 15% | |||
| Opportunity ranking consistency | 10% | |||
| Timeliness and coverage | 10% | |||
| Workflow, exports, API | 5% |
Reading the Results: What Actually Moves the Needle
Once the worksheet is filled in, the pattern is usually less dramatic than sellers expect. Below are the observations that most often show up when sellers run this test. Because neither vendor publishes an independently audited accuracy study, treat each point as a hypothesis to confirm in your own category rather than an established benchmark.
- Tool-to-tool differences are smaller than expected in stable subcategories, and much larger in messy ones. When a product sells steadily at a stable price with a single variation, rank-based curves fit well and both tools tend to land in a similar range. In seasonal, bundle-heavy, or deal-driven niches, the curves diverge and the gap widens.
- Units and revenue can disagree inside the same tool. If a model assumes list price while the listing has been running coupons for weeks, the revenue estimate drifts while the unit estimate stays roughly right. Always check which one you are comparing.
- Keyword volume differences cluster in the long tail. Tools anchored to Amazon search frequency style data tend to preserve ordering better across head and mid-tail terms. Tools that extrapolate from broader web or panel data can inflate niche phrases. Test ordering, not absolute values.
- Keyword difficulty scores are not comparable between vendors. Two tools can both be internally consistent while reporting very different difficulty values for the same keyword, because the formulas use different inputs such as review counts, ad density, brand dominance, and click concentration. Compare within one tool only.
- Coverage and freshness often separate tools more than headline accuracy does. How fast a new ASIN appears, how deep long-tail keyword coverage runs in your niche, and how much history you can export will affect your daily work more than a few percentage points of estimation error.
- Category-level accuracy varies more than tool-level accuracy. The same tool can be strong in Home and Kitchen and weak in seasonal apparel or fast-moving consumables. This is exactly why a generic comparison cannot answer your question, and why testing inside your own subcategory is non-negotiable.
Turning the worksheet into a decision
Record the following for each tool: median absolute percentage error on units, mean signed error (bias direction), top-ten keyword ordering overlap with your reference data, indexation misses, and the number of control ASINs missing from the database entirely. Those five fields tell you more than any composite score.
Then apply a practical heuristic. If a tool's estimates fall within roughly 30% of verified reality on steady products and its ordering matches yours, it is usually solid enough for go/no-go decisions and conservative inventory planning. If errors exceed that and swing unpredictably between ASINs, use the tool only for relative comparison between products, and never for a first-order inventory commitment. Treat that threshold as a working rule of thumb that many experienced sellers use, not as a published industry standard.
AMZScout vs. SellerSprite: Side-by-Side Comparison
The table below summarizes publicly available vendor documentation and product positioning at the time of writing. Feature sets, plan limits, and data coverage change frequently, so confirm the current details on each vendor's site before you subscribe. Neither vendor publishes a third-party-audited accuracy study, and this table does not replace your own test results.
| Dimension | AMZScout | SellerSprite |
|---|---|---|
| Core positioning | All-in-one Amazon research suite with a beginner-friendly product database and extensive training content. | Keyword-and-data platform built around a large Amazon keyword database, reverse-ASIN traffic analysis, and bulk research or API workflows. |
| Sales estimates | Modeled from rank, category, and price signals; presented as estimated monthly sales and revenue. | Multi-parameter modeled estimate with bulk estimation and variation handling. |
| Keyword data | Search volume, related keywords, and keyword tracking inside the research suite. | Keyword database with volume, difficulty, click and conversion share, plus reverse-ASIN keyword mining. |
| US marketplace depth | Solid US coverage with support for additional marketplaces. | Deep US coverage alongside major international marketplaces, positioned for keyword-first research. |
| Browser extension | On-listing data overlays inside the Amazon page. | On-listing overlays for keyword, traffic, and sales data. |
| Bulk work and exports | Bulk research and list exports, with limits that depend on the plan. | Bulk research, exports, historical data, and API access on higher tiers. |
| Team and agency use | Well suited to solo sellers and small teams. | Practical for agencies, brands, and teams needing shared data and automation. |
| Learning curve | Gentle, with a large library of tutorials aimed at new sellers. | Denser interface that rewards sellers who already understand keyword strategy. |
| Pricing structure | Tiered subscription with trial access; verify current US pricing. | Tiered subscription with limited free or trial access; verify current pricing. |
| Typical best fit | First-time and budget-conscious sellers who want guided research. | Sellers and teams who live in keyword data and need scale. |
Read this table honestly and you will notice something important: the two products are not really competing on the same axis. One optimizes for accessibility and a smooth research workflow. The other optimizes for keyword depth, coverage, and volume of data you can process. That means the answer to "which is more accurate" depends less on engineering quality and more on whether your daily work is closer to browsing a product database or mining a keyword universe.
Which Tool Fits Which Type of US Seller
The most useful way to choose is to start from your workflow, then let the accuracy test break the tie. Here is how the decision usually plays out across the four seller profiles we see most often in the US market.
New sellers validating a first product
Your bottleneck is not data volume, it is confidence. You need a clean demand estimate, a sanity check on competition, and a low monthly cost while you are still learning. Run the control-set test on 10 ASINs in the one niche you are seriously considering, not on random products. Check the "bought in past month" badge and review velocity as coarse cross-checks, and treat any estimate as a range rather than a promise. If you want a broader view of how the research stack fits together before you commit, the best Amazon FBA product research tools comparison is a useful companion to this page.
Growing sellers in the roughly $10k to $100k per month range
At this stage the constraint shifts from demand discovery to traffic acquisition. You care about keyword depth, which terms competitors actually convert on, how your own listings rank over time, and which long-tail phrases are winnable. Build your test around keyword ordering and reverse-ASIN analysis rather than around sales estimates, because the sales number now influences sourcing quantity, not the entry decision. Rank tracking over 90 days will tell you more about a tool's value than any single month of estimates.
Operations and marketing managers
Your priorities are consistency, reporting, and repeatability across a team. A manager needs exports that match what analysts see in the interface, metrics that stay stable month to month, and shared access so two people are not pulling different numbers into the same deck. Weight the workflow and export columns of the worksheet more heavily than a solo seller would, and test whether the plan you would actually buy supports the seats and bulk limits your team needs. Seasonal campaign planning also depends on historical data depth, which varies by plan.
Brands and large sellers
At brand scale, accuracy matters for portfolio decisions, not single products. You need category and catalog-level monitoring, reliable handling of variations and parent-child relationships, API access for internal dashboards, and coverage across the marketplaces you sell in. Test the API early: field definitions, rate limits, and refresh cadence will determine whether the tool can feed your internal reporting without manual intervention. Also test how each tool handles a mature listing that has been running promotions for months, since that is the situation where estimation models diverge most.
Illustrative scenario: how the test changes a decision
Consider a composite example that reflects how this test is typically used in practice. A two-person US seller evaluating a $28 kitchen accessory pulls estimates from both tools. One shows roughly 900 units per month for the leading competitor; the other shows about 640. Their own comparable ASIN, verified through Business Reports, suggests the realistic figure is closer to 500. Both tools overestimate, which is common for listings that ran a recent promotion during the sampling window. The deciding factor is not the headline gap but ordering: the second tool's top five keyword opportunities closely match the five terms the seller's own data shows are converting, and it correctly flags two long-tail phrases the first tool missed entirely. The seller enters with conservative inventory and a keyword-led launch plan.
This composite is illustrative, not a case study of a named client, and it is not a verified benchmark. Its purpose is to show the reasoning pattern: compare, verify against your own ground truth, then weight ordering at least as heavily as the absolute number.
If you want to run the same test on the SellerSprite side, you can create a free SellerSprite account and pull the identical control set, then compare the two exports in the same spreadsheet.
Six Mistakes That Distort Any Accuracy Comparison
Most accuracy arguments between sellers come from testing errors rather than tool errors. Avoid these six and your conclusions will be far more reliable.
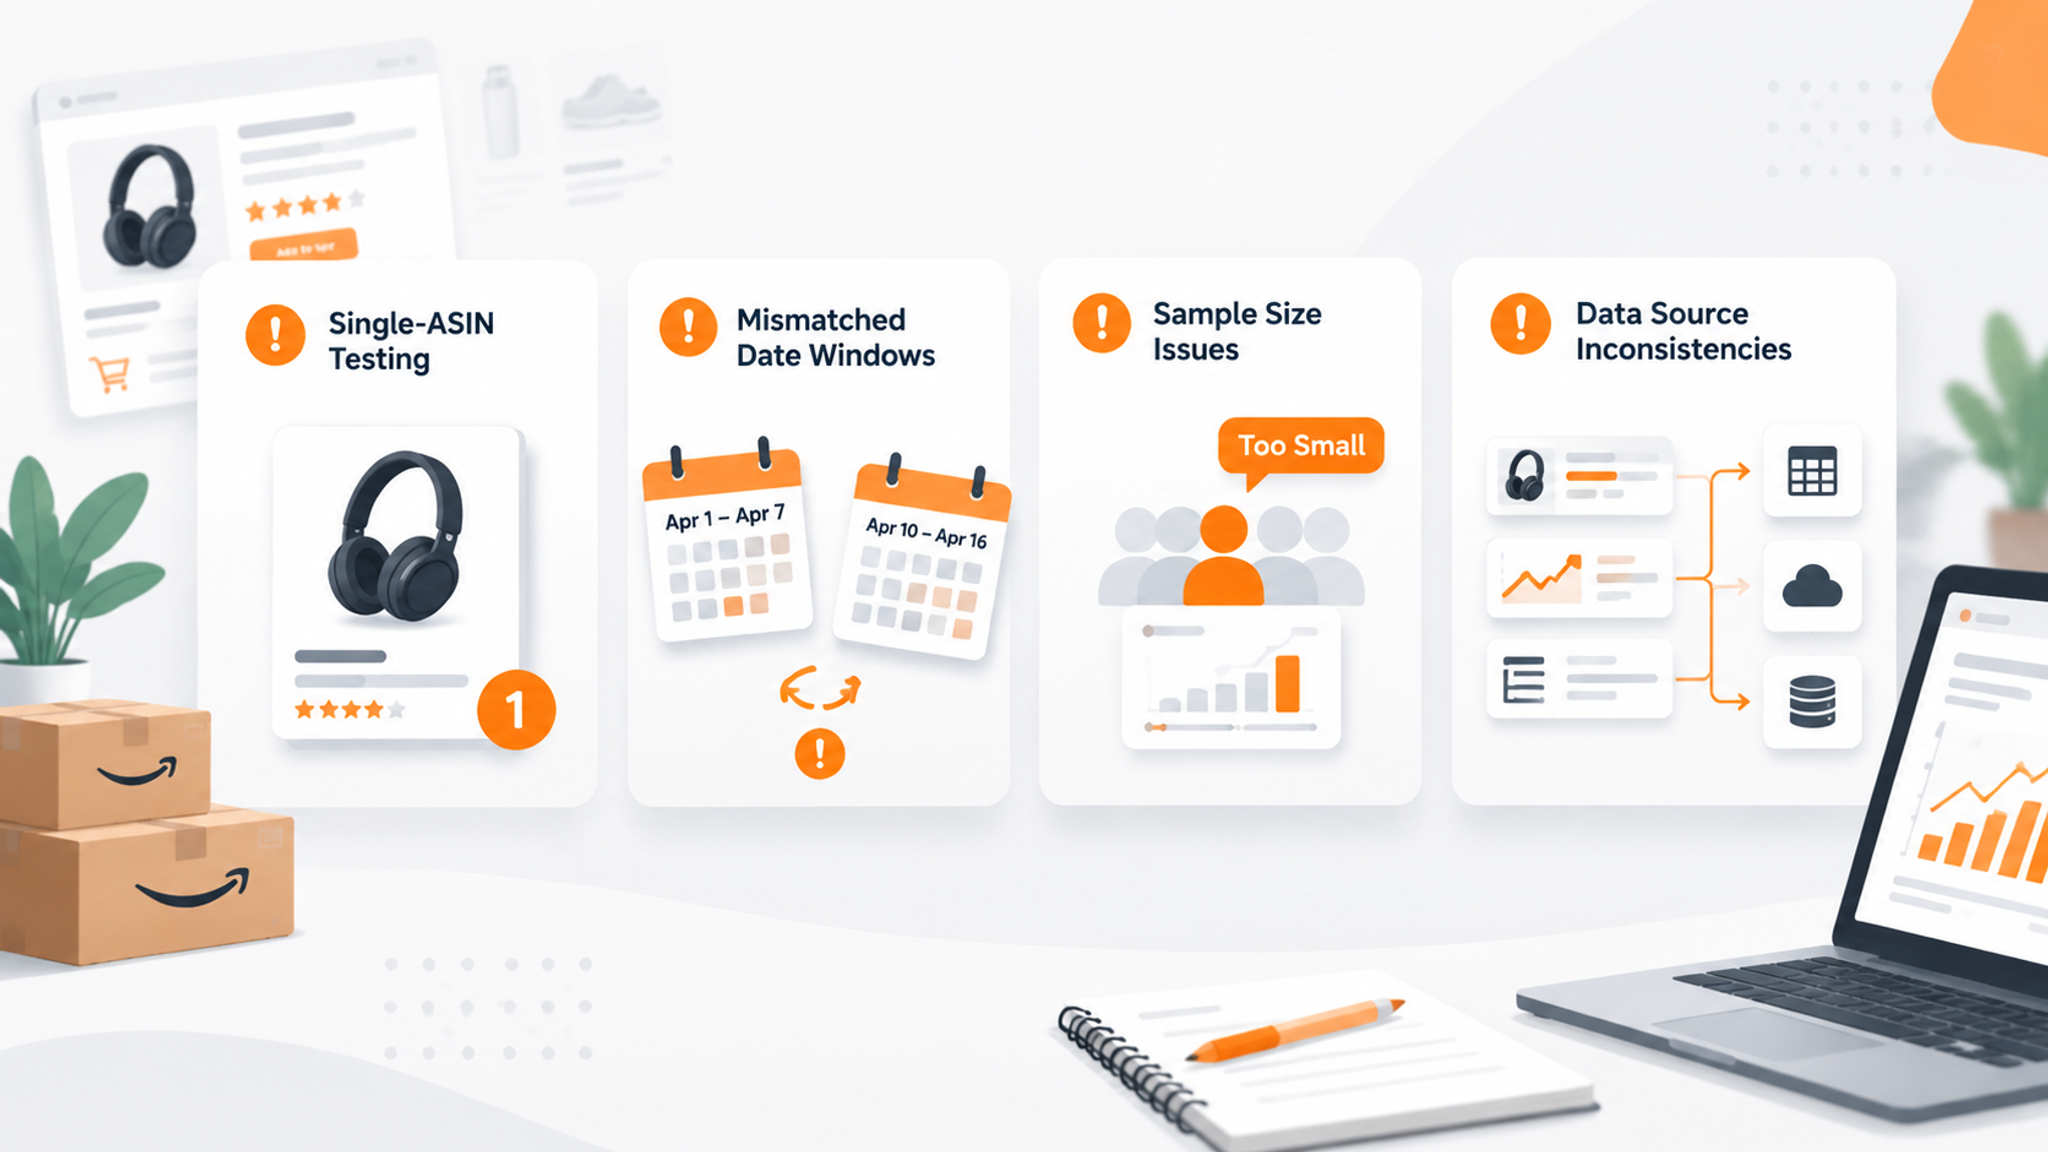
- Testing a single ASIN or a single keyword. One data point tells you nothing about spread, and spread is what breaks inventory plans. Twenty to thirty control ASINs is the minimum for a meaningful read.
- Comparing units against revenue. These are different estimates with different error sources. If you mix them, a pricing assumption can look like a demand error.
- Ignoring the date window and data lag. Two tools pulled a month apart are estimating different periods. Timestamp every export, and be careful not to judge a paid dataset by a limited free preview that may show less data or a coarser refresh.
- Expecting Amazon search volume to behave like Google search volume. Amazon keyword estimates reflect search frequency and click behavior inside Amazon, and are usually reported as ranges or indices. Comparing them to Google Keyword Planner numbers guarantees a misleading conclusion.
- Comparing difficulty scores across tools. Different formulas produce different scales. A score of 32 in one tool and 61 in another can describe the same keyword without either being wrong.
- Testing outside your own category, or during a seasonal spike. Run the test in your subcategory and in a clean month. A December test in a gift category will mislead you for the rest of the year.
Verdict: How to Decide in 30 Days
Both AMZScout and SellerSprite are established, legitimate tools with real user bases, and the honest verdict is that neither is universally more accurate. What differs is where each one invests: one in an accessible all-in-one research experience with strong onboarding, the other in keyword depth, coverage, and the bulk or API workflows that larger sellers need. If your daily work is keyword-first, US-market focused, and involves processing large lists of products or terms, SellerSprite is built for that workflow. If you are starting out and want a guided research environment with a gentler learning curve, AMZScout is a reasonable fit. Either way, do not take our word for it, or anyone else's.
A 30-day decision plan keeps you from over-committing:
- Week 1: Build the 20 to 30 ASIN control set in your own subcategory, with at least 8 of your own listings to provide verified ground truth.
- Week 2: Run Parts 1 through 3 of the test and record error and ordering results for both tools.
- Week 3: Run Parts 4 and 5, focusing on opportunity ranking and long-tail keyword coverage in your niche.
- Week 4: Buy monthly plans if needed, repeat the test once, and commit to the tool whose ordering matches your decision criteria. Keep the control set, and re-run it every six months as coverage and models change.
The tool you will actually use consistently, with an error profile you understand and can correct for, will beat a theoretically better tool you abandon in three weeks. That is the real accuracy standard worth optimizing for.
FAQ
Which tool is more accurate for Amazon sales estimates, AMZScout or SellerSprite?
There is no verified, third-party-audited accuracy benchmark that declares a winner, and both tools estimate sales from public signals such as Best Sellers Rank, category curves, and price history, so any universal claim should be treated with caution. In practice, accuracy is category-specific: in stable, high-volume subcategories with single-variation products, well-built models tend to land in similar ranges, while seasonal, bundle-heavy, or promotion-driven niches produce wider gaps. The reliable answer comes from running a control-set test in your own subcategory using 20 to 30 ASINs, eight or more of them your own listings, and comparing both tools against verified Business Reports data. Measure median absolute error, bias direction, and ordering consistency rather than chasing the single most accurate-looking number.
How do AMZScout and SellerSprite calculate their Amazon product and keyword data?
Neither tool has access to Amazon's actual transaction records. Both reconstruct estimates from a shared pipeline: scheduled Best Sellers Rank snapshots, category-specific conversion curves that turn rank into daily units, price history to convert units into revenue, review and rating velocity as cross-checks, seasonality indices, and calibration sets of products with known performance. On the keyword side, the inputs are Amazon autocomplete and related-search data, large-scale rank tracking, click and conversion signals, and search frequency style data. AMZScout is documented as an all-in-one research suite with modeled sales and keyword modules, while SellerSprite is built keyword-first, leaning on a large Amazon keyword database and reverse-ASIN traffic analysis. Because the calibration windows, variant handling, deal treatment, and refresh cadences differ, the two tools can produce different numbers for the same listing without either being technically broken. Confirm current specifics in each vendor's documentation, since models and coverage change over time.
Is SellerSprite or AMZScout better for Amazon FBA product research in the US market?
It depends on the workflow that dominates your week. If you spend most of your time on keyword research, competitor traffic analysis, long-tail expansion, and bulk processing, SellerSprite's keyword-first design with deep US coverage, reverse-ASIN analysis, exports, and API access tends to fit that work better. If you are newer to FBA and want a guided research experience with a simpler interface, extensive tutorials, and a product database that is easy to browse, AMZScout is often the friendlier starting point. A practical compromise many US sellers use is to run both on a monthly plan during a single product validation cycle, then keep the one whose ranking of opportunities matches their own verified data. Whichever you choose, test it on your subcategory rather than on generic bestseller lists.
Can any third-party tool give me 100% accurate Amazon sales data?
No. Amazon does not publish per-ASIN unit sales, so exact figures are only visible to the brand that owns the listing through Business Reports and Brand Analytics. Every third-party number is a model estimate built from indirect signals, which is why the useful question is not whether a tool is exact but how large and how consistent its error is in your category. A tool with a stable, measurable bias is workable because you can correct for it; a tool whose error swings unpredictably from product to product is not safe for inventory commitments. Always verify against your own seller data whenever you have it, and treat competitor estimates as directional ranges rather than facts.
How long should I test an Amazon research tool before deciding?
Thirty days is usually enough if you run the test properly. Spend the first week building a control set of 20 to 30 ASINs in your own subcategory, then use the next three weeks to measure sales estimate error, keyword ordering overlap, indexation accuracy, and coverage or freshness. Two practical rules make the result trustworthy: keep the evaluation window to a single complete calendar month so both tools estimate the same period, and avoid months distorted by major promotional events or stark seasonality. Re-run the same control set every six months, because vendor models, data coverage, and refresh cadences change, and yesterday's conclusion may not hold next year.
Next Steps
- Download your Business Reports for the last complete calendar month and list 20 to 30 control ASINs in your subcategory, including at least eight of your own listings.
- Run the five-part test on both tools in the same week, timestamp every export, and record median error, bias direction, and top-ten keyword ordering overlap in one spreadsheet.
- Review the broader tool landscape in our guide to the best Amazon seller tools so you are not evaluating sales and keyword estimation in isolation.
- Deepen the keyword half of the test with our Amazon search volume tool guide, then create a free SellerSprite account and pull the same control set to compare side by side.
References
- Amazon Brand Analytics and Search Query Performance documentation for sellers View
- Amazon Product Opportunity Explorer overview for demand and niche research View
- Amazon FBA Revenue Calculator for sanity-checking price, fees, and margin assumptions View
- AMZScout official product and feature documentation View
- SellerSprite official product, keyword database, and API documentation View
- SellerSprite guide to how Amazon search volume is estimated View
- Editorial note: vendor features, plan limits, and pricing change frequently, and no third-party-audited accuracy benchmark for these tools was located at the time of writing. Verify all product details on each vendor's site before purchasing.
By SellerSprite Content Expert
Amazon seller tools and marketplace SEO specialist.
Editorial process: AI-assisted draft prepared for human fact-checking, source verification, and brand review before publication.