TL;DR: Unit Session Percentage is Amazon’s unique metric that measures how many units customers buy per 100 sessions, revealing the true quality of your traffic. Unlike conversion rate, it accounts for multiple-item orders, making it more accurate for assessing listing performance. Learn how to calculate, benchmark, and boost it for higher profitability.
Key Takeaways
- Unit Session Percentage (USP) = (Units Ordered ÷ Total Sessions) × 100; it’s a clearer indicator of buyer intent than metrics like page views.
- While order session percentage treats a multi-unit order as one conversion, USP counts each unit sold, rewarding product bundling and upselling.
- A “good” USP varies by category—aim for 8–15% in competitive spaces, but track your own trends over time.
- Traffic quality matters more than volume; attracting irrelevant visitors tanks your USP, so focus on targeted keywords and high-intent ad placements.
- Improving USP requires a holistic approach: optimize listings, price competitively, run smart PPC, and nurture repeat purchases.
Table of Contents
Note on marketplaces: This guide is specifically optimized for the US market.
What Is Amazon Unit Session Percentage?
Amazon’s Brand Analytics dashboard and Business Reports are goldmines for sellers, but one metric consistently stumps even experienced operators: Unit Session Percentage. In plain English, it’s the percentage of shopping sessions on your product detail page that result in one or more units sold. The formula is straightforward: (Total Units Ordered ÷ Total Sessions) × 100. But the real value lies in what it communicates about your Amazon seller analytics—namely, whether the traffic you’re attracting is actually interested in buying.
For example, if your listing received 1,000 sessions in a week and 150 units were ordered, your unit session percentage is 15%. That means out of every 100 visits to your product page, 15 units were purchased. Notably, a single session can lead to multiple-unit orders (e.g., a customer buys 3 units of the same item), and every unit counts toward this metric. This gives a far more accurate picture of buyer intent than raw order counts or even conversion rate alone.
Traffic quality sits at the heart of unit session percentage. You can drive 10,000 sessions from a broad keyword like “kitchen accessories,” but if only 20 visitors buy, your 0.2% USP screams “irrelevant traffic.” In contrast, 500 sessions from a laser-focused keyword such as “presale limited edition stainless steel garlic press” could deliver a 20% USP. That’s the “truth about traffic”: it’s not about volume; it’s about alignment between what you offer and who you invite.
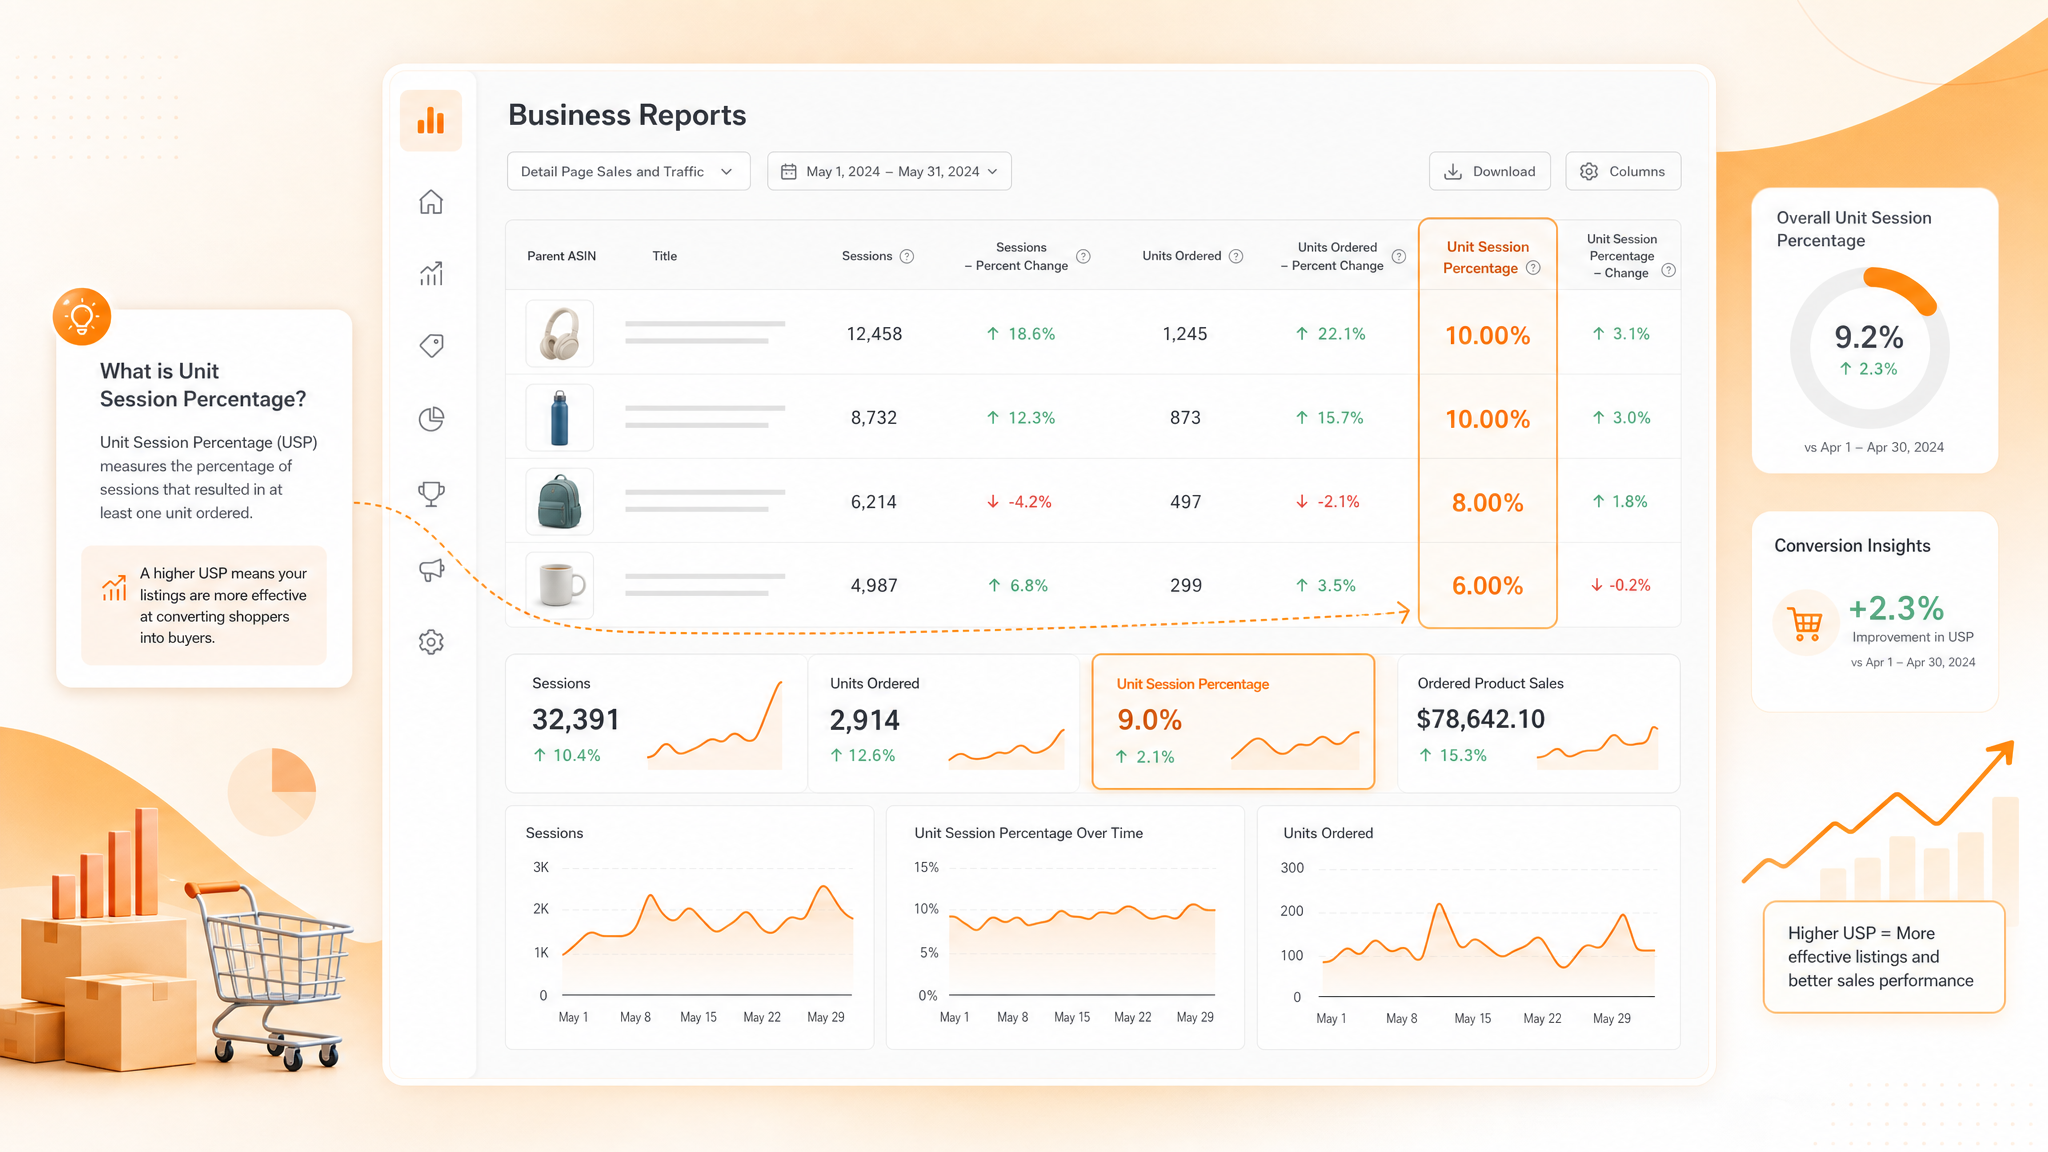
The Formula in Detail
Unit Session Percentage = (Total Units Ordered ÷ Total Sessions) × 100
- Units Ordered: The sum of individual units purchased across all orders in the selected period. If one order contains 3 units, it counts as 3.
- Sessions: A session is defined as a unique visit to your product detail page within a 24-hour window. If the same customer views the page multiple times in that window, it’s counted as one session. This filters out “refresh” noise and gives a truer signal of unique shopper interest.
This metric appears in two places: the Detail Page Sales and Traffic report by ASIN (under Business Reports) and the Brand Analytics section for brand-registered sellers. The latter adds even more depth, allowing you to compare performance across your brand’s entire catalog and spot trends.
Why does this metric matter so much? Because it bridges the gap between marketing efforts and actual sales. A high USP signals that your traffic is highly relevant, your listing convincing, and your offer competitive. A low USP can be an early warning—before you waste ad spend on the wrong audiences.
Unit Session Percentage vs. Conversion Rate: What’s the Difference?
New sellers often confuse unit session percentage with the traditional conversion rate (officially called Order Item Session Percentage on Amazon). While related, they measure entirely different things, and understanding this distinction is crucial for accurate performance analysis.
Amazon’s Order Item Session Percentage is what most refer to as “conversion rate.” It’s calculated as (Number of Orders ÷ Number of Sessions) × 100. One order counts as one, regardless of how many units it contains. If 100 sessions lead to 10 orders (each potentially containing multiple items), the order item session percentage is 10%. Meanwhile, unit session percentage would be higher if those 10 orders included 25 units total—then USP = 25%.
Which one should you track? Both, but for different reasons:
- Order Item Session Percentage (Conversion Rate) tells you how effectively your listing turns visitors into buyers at a transactional level. It’s ideal for A/B testing main images, pricing, and copy.
- Unit Session Percentage reveals the completeness of each purchase. If customers consistently buy multiple units, your USP will outpace conversion rate—a sign of strong product-market fit or effective bundling.
A practical case: A yoga mat seller runs a sponsored products campaign. They see an order conversion rate of 8% but a unit session percentage of 12%. The gap suggests that 4 out of every 100 sessions are adding more than one mat (perhaps a pair) to the cart. This insight can inform bundle offers: “Buy 2, save 10%” might already be paying off without a promo. Conversely, if USP is lower than conversion rate, it’s impossible—unit count can’t dip below orders because each order has at least one unit. The two metrics will match only when every order contains exactly one unit.
Traffic quality ties both together. A flood of low-intent traffic drags down both metrics, but unit session percentage can drop more dramatically because it reflects the total units lost. For example, if irrelevant sessions reduce orders by 50% and also cut multi-unit purchases, USP may fall from 15% to 5% while order conversion might decline from 10% to 5%. Monitoring USP helps you catch the full impact sooner.
What Is a Good Unit Session Percentage on Amazon?
There’s no universal “good” number because the ideal unit session percentage varies by category, price point, and competition level. However, based on thousands of seller accounts aggregated by analytics platforms, benchmarks emerge:
- General average: 4–7% across all categories.
- Niche products with low price points: 8–15% (e.g., supplements, phone cases).
- High-consideration items: 2–5% (e.g., expensive electronics, furniture).
- Staple consumables with strong brand loyalty: 10–20% (e.g., pet food, paper towels).
But numbers alone mislead. A 5% USP on a $500 espresso machine might generate more profit than a 20% USP on a $10 phone charger. Context is king. A more reliable method: compare your USP to your own historical performance and to direct competitors in the same subcategory using Brand Analytics’ “Item Comparison” and “Alternate Purchase” reports.
One overlooked truth: traffic quality dramatically skews benchmarks. A competitor spending big on broad-match PPC might report a 3% USP, while another using only precise long-tail keywords achieves 12%. The first seller gets more “traffic,” but the second gets more sales per session. When evaluating your performance, always segment by traffic source—branded vs. non-branded, organic vs. paid—to see where quality lags. Use SellerSprite’s keyword research tool to identify high-intent search terms that align with your product, then focus your SEO and PPC there.
Finally, aim for improvement, not perfection. A realistic goal for most established products is to maintain at least a 5–8% USP while gradually increasing through optimization. New products may struggle to hit 3% at launch; that’s normal, as reviews and ranking build over time.
7 Proven Strategies to Improve Your Unit Session Percentage
Boosting your unit session percentage isn’t about one magic trick; it’s a sustained effort across listing optimization, traffic targeting, and post-purchase engagement. Here are seven actionable strategies, grounded in real seller experiences.
1. Tighten Your Keyword Targeting and Ad Placements
The fastest way to lift USP is to stop inviting window shoppers. Audit your Sponsored Products campaigns: pause or negate broad-match keywords that generate clicks but no orders. Shift budget toward exact-match long-tail keywords with high purchase intent. For example, instead of “dog toys,” target “indestructible dog toys for aggressive chewers large breed tested.” Use Amazon’s Search Term Report to identify which search terms actually lead to sales, then build campaigns around those.
Pro tip: Use SellerSprite’s Reverse ASIN tool to see the exact keywords your top competitors rank for organically and in ads. Replicate their high-converting terms but also find “gap” phrases they’re missing—this can attract ready-to-buy shoppers.
2. Elevate Your Listing Content to Answer Every Question
A curious but unconvinced browser becomes a buyer only when all objections are resolved. Study your product’s Q&A section and customer reviews—both positive and negative—to uncover common questions and pain points. Then update your bullet points, product description, and A+ Content (if brand registered) to address them preemptively.
For instance, a seller of portable blenders noticed questions like “Can it crush ice?” They added a bullet point: “Powerful 300W motor easily crushes ice, frozen fruit, and hard veggies in under 30 seconds.” Within a month, USP rose from 6% to 9%. Always include size charts, compatibility notes, and material details to reduce returns and boost confidence.
3. Price Competitively—and Actively Test
Price is the #1 decision factor for most Amazon shoppers. If your product is 20% more expensive than the next best alternative with similar ratings, even high-intent traffic will bounce. Use automated repricing tools, but don’t race to the bottom. Test psychological price endings (.97 vs .99), bundle pricing (e.g., “Buy 2 and save 15%”), and limited-time coupons visible in search results.
A supplement brand we analyzed tested a “Subscribe & Save” discount of 10% vs. a one-time coupon of 5%. The subscription offer not only lifted USP by 4 percentage points but also locked in recurring revenue. Note: for Subscribe & Save, USP may initially dip as more units ship per order, but long-term customer value skyrockets.
4. Master Main Image and Gallery Optimization
On Amazon, the main image is your first—and often only—chance to stop a scroll. Ensure your hero image follows Amazon’s guidelines: pure white background, product occupying at least 85% of the frame, and crisp resolution. But beyond compliance, include lifestyle images that show the product in use, dimension overlays, and benefit-driven infographics. A/B test your main image using Amazon’s “Manage Your Experiments” tool if brand registered.
A home goods seller rotated their main image from a plain product shot to a scene showing the serving tray elegantly arranged with cheese and wine. Unit session percentage increased from 5.2% to 8.5% within two weeks—the power of contextual selling.
5. Nail Inventory Management to Avoid Stockouts
Nothing kills unit session percentage faster than the feared “Currently Unavailable” badge. When stock runs out, every session continues to count against your USP while no units are ordered. Even worse, Amazon’s algorithm punishes your ranking, leading to lower impressions when you restock—a double hit. Implement inventory alerts, safety stock thresholds, and consider Amazon’s FBA restock recommendations powered by sales velocity forecasting.
For seasonal spikes, use historical data to predict demand. A toy seller using SellerSprite’s sales estimation tool anticipated a Q4 surge and shipped extra units to FBA by October. They maintained a 12% USP throughout December while competitors stockout and saw a 30% drop.
6. Leverage Post-Purchase Engagement for Repeat Sales
Unit session percentage improves not just from new sessions but from existing customers returning to buy more. Encourage repeat purchases through brand followership, email marketing (with Amazon’s Buyer-Seller Messaging guidelines), and product inserts that guide customers to your Brand Store or Subscribe & Save options.
A coffee pod seller included a simple insert: “Love our pods? Set up Subscribe & Save for 10% off every month.” Over six months, their USP rose from 9% to 14% as more sessions turned into multi-month commitments. These returning sessions are inherently high-quality; the shopper already trusts your brand.
7. Keep an Eagle Eye on Competitor Moves—and Your Own Data
USP doesn’t exist in a vacuum. If a competitor launches a similar product at a lower price or with a killer promotional video, your USP can nosedive overnight. Use tools like SellerSprite’s product tracker to monitor changes in your own USP trends alongside competitors’ pricing, listing changes, and keyword rankings. Set alerts for when your USP drops below a threshold—say, 5% for a high-volume SKU—so you can investigate immediately.
Data-driven routine: Weekly, compare your USP by traffic source (organic, sponsored brands, sponsored products). If paid traffic shows a 3% USP but organic is at 10%, stop the bleed on poor ad placements. Monthly, review your Brand Analytics’ “Market Basket Analysis” to see which products are frequently bought together—and create bundles to capitalize on multi-unit trends.
Common Pitfalls When Optimizing Unit Session Percentage
Even seasoned sellers fall into traps that inadvertently lower unit session percentage or misread its signals. Here are the most frequent mistakes:
1. Chasing Vanity Traffic with Broad Ad Campaigns
A high number of sessions feels good, but if they’re driven by mismatched keywords, USP plummets. A seller of ergonomic office chairs targeting “desk chair” saw 50,000 monthly sessions but a 2% USP. After refining to “ergonomic mesh office chair with lumbar support for tall people”, sessions dropped to 8,000 but USP surged to 11%. Quality over quantity.
2. Ignoring Mobile Experience
Over 60% of Amazon shopping happens on mobile devices. If your bullet points are truncated or images don’t render well on smaller screens, buyers bounce. Always preview your listing on a smartphone and ensure the first three bullet points (visible without “see more”) contain the most compelling benefits and a call to action.
3. Obsessing Over USP Alone Without Context
A high USP isn’t always good. If you’re selling a $5 item and achieving a 25% USP but barely breaking even, you might be underpricing. Conversely, a luxury seller with a 2% USP could be highly profitable. Always tie USP back to unit margin and customer lifetime value. Use it as a diagnostic, not a vanity metric.
4. Neglecting Feedback and Reviews
A product with a 3.5-star average suffers a heavy conversion penalty. Amazon’s algorithm itself may reduce impressions if ratings are low, further suppressing USP. Actively solicit reviews through Amazon’s “Request a Review” button, respond to negative reviews with solutions, and ensure the product quality matches expectations set by your listing.
Next Steps
- Log into Amazon Seller Central, navigate to Business Reports, and calculate your current unit session percentage for your top 5 ASINs.
- Use SellerSprite’s free tools to audit your keyword performance and identify high-intent search terms with low competition.
- Implement at least two of the strategies from section 4 this week—start with ad targeting refinement and listing Q&A improvements.
FAQ
What is a good unit session percentage on Amazon?
A “good” unit session percentage typically falls between 5% and 15%, but it heavily depends on your product category, price, and competition. Low-priced consumables often see 10-20%, while high-ticket items may only hit 2-5%. Instead of chasing an arbitrary number, track your own trend over time and compare against similar products using Amazon Brand Analytics.
How can I increase my unit session percentage?
Focus on improving traffic quality by targeting precise, high-intent keywords; optimize your listing’s main image, bullet points, and A+ Content; price competitively; avoid stockouts; and encourage repeat purchases through Subscribe & Save. Regularly review your ad campaigns and negative irrelevant search terms.
What is the difference between unit session percentage and conversion rate?
Amazon’s conversion rate (Order Item Session Percentage) counts each order as one conversion, regardless of how many units are in that order. Unit Session Percentage counts each individual unit sold per session. If customers often buy multiple units, USP will be higher than conversion rate, making it a better indicator of multi-item purchasing behavior.
References
- Amazon Seller Central Help: Understand Unit Session Percentage View
- Amazon Brand Analytics Guide View
- SellerSprite Amazon Analytics Blog View
By SellerSprite Content Expert
Amazon seller tools and marketplace SEO specialist.
Editorial process: AI-assisted draft prepared for human fact-checking, source verification, and brand review before publication.